Microba's Community Profiler enables precise measurement of the gut microbiome

Introduction
Featured in Frontiers in Microbiology.
Accurately identifying the microbial species present in biological samples is essential for understanding their role in clinical and environmental applications. In the context of the human microbiome, this is critical for establishing links between microbial species and health and disease. Our inability to culture most in situ microbial populations has severely limited our understanding of microbial ecosystems1,2, and even highly studied habitats such as the human gut lack cultured representatives for ~70% of the component species3.
The application of metagenomic sequencing – the recovery and analysis of all genomic DNA in a clinical or environmental sample – has transformed the study of microbial ecosystems by bypassing this cultivation bottleneck, providing an unbiased and comprehensive view of the taxonomic and functional composition of microbial communities and enabling the discovery of novel species within a sample.
The accurate analysis and interpretation of metagenomic datasets remains a computational challenge due to their complexity, the comparatively short read length of sequencing technologies, and incomplete genome reference databases4,5. There is, therefore, a critical need for taxonomic profiling tools to keep up with advancements in sequencing technologies.
Several approaches are presently used to estimate the relative abundance of species in a metagenomic sample. These can be grouped into four categories based on how sequence similarity is established: i) genome alignment approaches such as Centrifuge6, ii) protein alignment approaches such as Kaiju7 and DIAMOND8, iii) marker gene approaches such as MetaPhlAn9 and mOTUs10, and iv) composition or k-mer based approaches such as Kraken11, Bracken12, MetaCache13, and Ganon14
Here we benchmark the Microba Community Profiler (MCP), which uses a genome alignment approach, against existing metagenomic classifiers using 140 in silico mock microbial communities comprised of varying numbers of bacterial and archaeal species. The 140 mock communities span 6,971 unique species from 2,268 genera and 50 phyla, and contain species ranging from 0.0000019% to 80.5% of the community. Recognising that the quality of the reference database has a large influence on the performance of classifiers, we developed a single standardised reference database to compare classifier performance5,15,16.
The mock communities were stratified by how close the genomes matched the representatives in the standardised reference database using the measure of average nucleotide identity (ANI). This resulted in mock communities with identical, high, moderate and low ANIs. For the purposes of this summary, the figures below used only the high and moderate ANI mock communities (80 total mock communities), as these ANIs are the most representative of gut microbiome samples
Superior Detection Limit
The in silico mock communities were used to establish detection limits for the different classifiers. The detection limit is the lowest abundance that a species in a sample can be identified before an unacceptable number of false positives are reported. It is important to minimise false positives to have confidence in the species reported by a classifier. We define the detection limit of each classifier as the lowest reported abundance at which a target false discovery rate (FDR) can be achieved. At an FDR of 0.1% (where an FDR of 0.1% indicates that 1 in 1000 species is expected to be a false positive), the MCP had the lowest overall mean detection limit at 0.007%. When comparing detection limits across multiple target FDRs, the MCP maintained the lowest detection limit, whereas there was substantial variation between other classifiers (Figure 1).
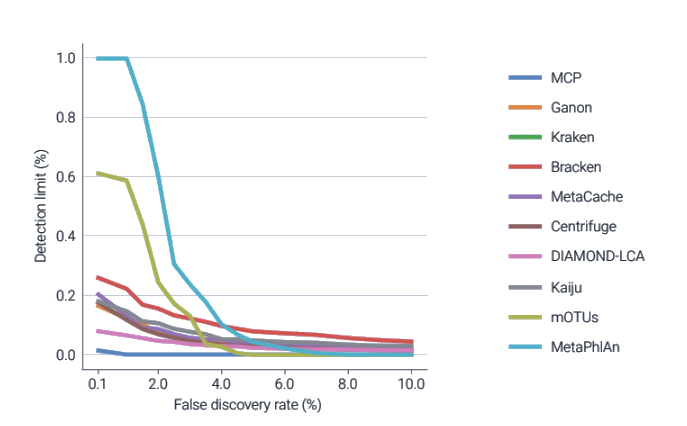
Figure 1.
Comparison of minimum detection limits at which species can be reliably detected by classifiers
With a detection limit of 0.007%, the MCP was 20-60 times more sensitive than other metagenomic classifiers.
Best Performance in Predicting the Presence or Absence of Species
Here, the in silico mock communities were used to determine the performance of species predictions (presence or absence of species) for the different metagenomic classifiers using an F1 score (see below). For this analysis, we first removed low abundance populations <0.01%, which ensures more accurate results by acknowledging that species comprising the “long tail” of microbial communities17,18 cannot be identified by most metagenomic classifiers without reporting unacceptable numbers of false positives (Figure 1).
In computational prediction models, an F1 score is a measure of a test’s performance, with the highest possible value of 1. The F1 score is calculated based on the precision and recall of the classifier, where precision is the proportion of correctly identified species out of all species identified, and recall is the proportion of correctly identified species out of all species that should have been identified. There is typically a trade-off between precision and recall, and it is important to optimise this balance to increase the overall performance of the classifier. Giving equal weight to precision and recall, this analysis shows the MCP is the most accurate (F1= 0.97) at predicting the presence or absence of species (Figure 2).
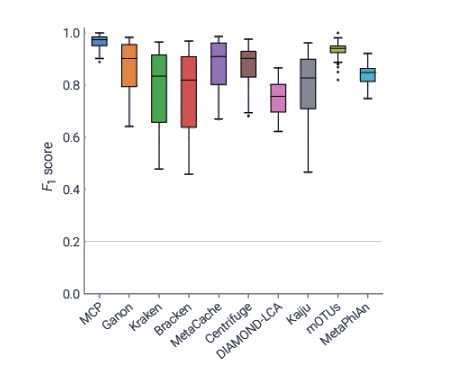
Figure 2.
Comparison of F1 score amongst metagenomic classifiers
With an F1 score of 0.97, the MCP has superior recall and precision, outperforming other classifiers by 5-20%
Equivalent or Superior Relative Abundance Estimates
In addition to accurately identifying the presence or absence of a species, it is also important that a classifier can accurately estimate the relative abundance of a species. This was assessed by calculating the L1 distance, which is the absolute difference between predicted and mock profiles, for all 140 in silico mock communities (with mock communities filtered to remove species present at <0.01% abundance). These results indicate that MCP, Ganon, Kraken, Bracken, and MetaCache are all able to provide reasonably accurate species abundance estimates (Figure 3).
We further assessed the percent of the predicted community that was comprised of false positive and false negative species using the in silico mock communities. The MCP predicted a substantially lower overall percent abundance of false positive species compared to the other classifiers, while still maintaining a low overall percent abundance of false negatives (Table 1).
This highlights the trade-off between false negative and false positive predictions, and shows the MCP favours a slight increase in the percent of the community that is not detected (false negatives) in order to substantially reduce the percent of the community comprised of erroneously reported species (false positives)
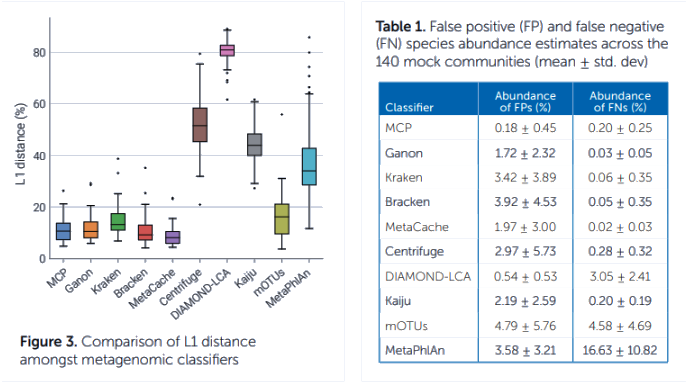
The MCP can accurately predict the relative abundance of species and the abundance of erroneously identified species is 4 -16x’s less than other classifiers.
The MCP Identifies More Species
In recent years, the application of metagenomic sequencing has shed light on the numerous links between the gut microbiome and human health. The gut microbiome has been associated with a range of diseases including metabolic diseases19, gastrointestinal disorders20 and even cancer21, making it critical to have accurate and comprehensive characterisation of communities to help guide diagnostics and therapeutic strategies.
Therefore, we evaluated the performance of the strongest performing classifiers on human faecal metagenomes. Community profiles produced by MetaCache, Kraken, and Bracken were compared to those obtained using the MCP on a set of 100 de-identified Australian faecal metagenomes. Unlike the in silico mock community analysis, here each classifier was evaluated using its recommended reference database. MCP uses the Microba Genome Database (MGDB) which consists of 73,646 dereplicated genomes which span the 24,706 species clusters defined by the Genome Taxonomy Database22,23 and 3,540 additional species clusters consisting of MAGs and isolates from recent human gastrointestinal studies and Microba’s own initiatives to obtain MAGs from research participant samples and public metagenomes.
Since the community composition of the faecal samples are unknown, we used the percent of assigned DNA sequencing reads to evaluate classifier performance. Across the 100 faecal metagenomes, the MCP could assign an average of 84.4% of the DNA reads to a species, which was at least 25% more than the next closest performing classifier (Figure 4). This was attributed to the large number of uncultured gut microbiome species represented in MGDB that are absent from the reference databases used by the other classifiers, highlighting the need for a comprehensive reference database to achieve improved species identification by metagenomic classifiers.
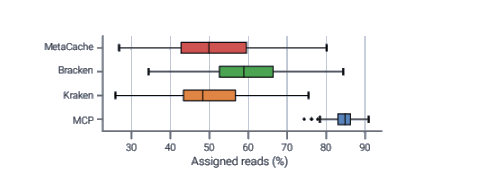
Figure 4.
Comparison of the percentage of DNA reads assigned to a species by metagenomic classifiers on 100 de-identified Australian faecal samples
Using Microba’s Genome Database, the MCP can assign at least 25% more DNA reads per sample than other classifiers.
Summary
The Microba Community Profiler was developed to provide accurate metagenomic profiles of faecal microbiomes.
Here we demonstrate that the MCP has a superior detection limit, the most reliable species predictions, equivalent or superior relative abundance estimates, and identifies at least 25% more species among all evaluated classifiers. Importantly, this analysis indicates that the MCP outperforms the other classifiers even when all classifiers use the same reference genome database.
The MCP is under ongoing development to further improve its detection limit and accuracy of species relative abundance estimates. In addition, the MGDB is constantly updated with the genomes of newly iIdentified species to improve the percent of assigned DNA sequencing reads.
While we will continually improve the performance of the MCP, the results of this study illustrate that the MCP is overall the best performing metagenomic classifier.
View References